Your Best Financial Partner
The ultimate set of financial analytic program for an expect of financial professionals.
It places the massive financial market data and analytic tools.
The ultimate set of financial analytic program for an expect of financial professionals.
It places the massive financial market data and analytic tools.
Download installation program in Customer Center>Download
After the installation of DataGuide, execute the program by double-clicking the DataGuide icon on the wallpaper
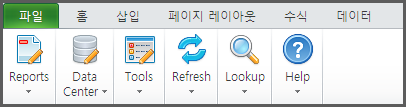
Generation of DataGuide menu in Excel 2007 version or higher
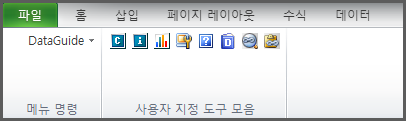
Generation of DataGuide menu in Excel 2003 version or lower
One-Click service of research and public announcement materials
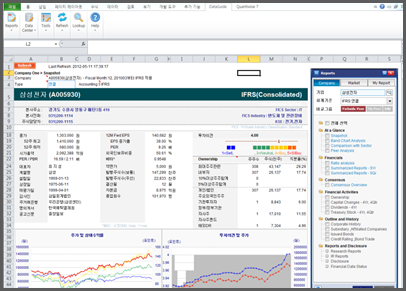
Provide the report with which you can analyze companies and market with One-Stop
By providing various item choice techniques and screens about the enterprises, sectors and related Data (Financial affairs, stock prices, economic variables) it helps the editing and the management of the portfolio of user and support the data output of 2 dimensions and 3 dimensions and analysis on outcome
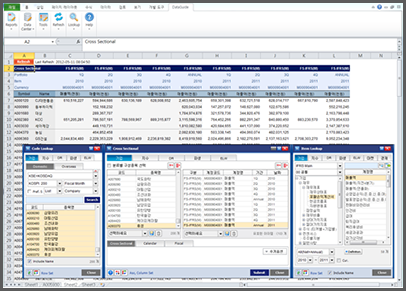
Cross Sectional / Time Series
Set Form
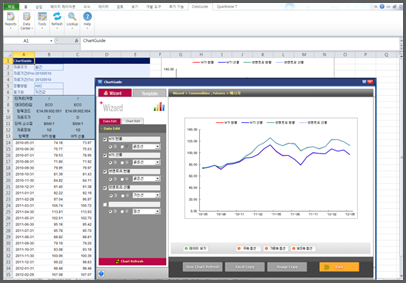
ChartGuide
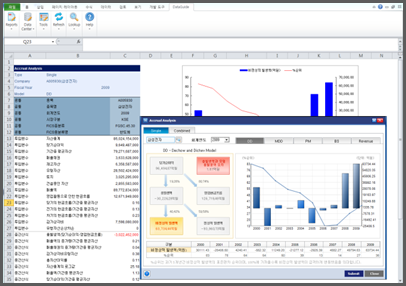
Accrual Analysis
IFRS Valuation
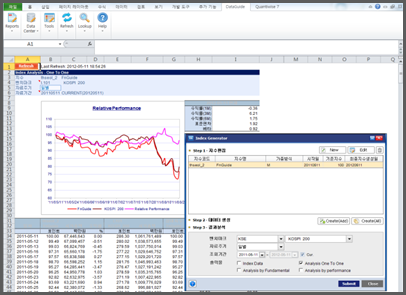
Index Generator
Stock Screener
Event Study